Hyperparameter Tuning Explained - Manual tuning, GridSearchCV and RandomizedSearchCV


Here, we’re diving into the world of hyperparameter tuning in machine learning. If you’re new to this topic, don’t worry. We’ll break it down step by step with simple explanations and code examples. We’ll also cover why tuning hyperparameters is important and explore different methods to do it.
What is Hyperparameter Tuning?
Hyperparameter tuning is like finding the best recipe for a dish. Just as a recipe has ingredients that you can adjust to make it taste better, machine learning models have parameters that you can tweak to improve their performance. These parameters are called hyperparameters.
Imagine you're making a cake. The amount of sugar, baking time, and oven temperature are like hyperparameters. If you get these just right, your cake turns out delicious. If not, it might not taste as good!
In machine learning, hyperparameters control how well your model learns from the data. For example, in a decision tree model, you might adjust the maximum depth of the tree or the minimum number of samples required to split an internal node.
Why Hyperparameter Tuning Helps
Just like a cake needs the right balance of ingredients, a machine learning model needs the right settings to perform well. Tuning hyperparameters helps you to
- Improve Model Performance - Get better accuracy or other performance metrics.
- Avoid Overfitting - Ensure your model generalizes well to new, unseen data.
- Optimize Training Time - Find settings that balance performance and speed.
Ways to Tune Hyperparameters
There are several methods to tune hyperparameters. Let's explore three popular ones: manual tuning, Grid Search CV, and Random Search CV.
- Manual Tuning
Manual tuning is like trial and error. You start with a set of hyperparameters, test them, and adjust based on performance. It’s simple but can be time-consuming and may not always find the best settings.
- GridSearchCV
GridSearchCV is like trying out every possible combination of hyperparameters within a specified range. It’s systematic and can find the best settings, but it can be computationally expensive.
- RandomizedSearchCV
RandomizedSearchCV randomly selects combinations of hyperparameters to test. It’s often faster than Grid Search CV and can still find good hyperparameters.
Okay, it's time to experiment with these techniques. To demonstrate these concepts, I am going to use the California Housing dataset from Scikit-Learn. Download the dataset (Or use scikit-learn to fetch) before moving forward. Here, we are going to predict housing prices based on various features. This is a regression problem, so we will use RandomForestRegressor from Scikit-Learn.
Important - Here I will guide you with basic steps for hyperparameter tuning. You need to do further research on how we can achiave best results
Let's code now
Download the full notebook here if you want to refer.
Import necessary tools
from sklearn.metrics import r2_score, mean_absolute_error, mean_squared_error
from sklearn.model_selection import train_test_split, RandomizedSearchCV, GridSearchCV
from sklearn.ensemble import RandomForestRegressor
from sklearn.datasets import fetch_california_housing
from sklearn.model_selection import GridSearchCV
import pandas as pd
import numpy as np
from sklearn.metrics import r2_score, mean_absolute_error, mean_squared_error - This imports functions for measuring how well your model is performing. r2_score tells you how well your model explains the variability of the data. mean_absolute_error measures the average errors in predictions. mean_squared_error measures the average squared errors in predictions.
from sklearn.model_selection import train_test_split, RandomizedSearchCV, GridSearchCV - This imports tools to split your data into training and testing sets, and to find the best hyperparameters for your model. train_test_split helps to split data into two sets. RandomizedSearchCV and GridSearchCV are methods for tuning hyperparameters.
from sklearn.ensemble import RandomForestRegressor - This imports the RandomForestRegressor model, which is a type of machine learning model used for regression tasks.
from sklearn.datasets import fetch_california_housing - This imports a function to get a dataset with information about California housing. This dataset is often used for practicing machine learning.
import pandas as pd - This imports pandas, a library for data manipulation and analysis.
import numpy as np - This imports numpy, a library for numerical operations, like working with arrays and matrices.
Load California housing dataset
housing = fetch_california_housing()

housing_df = pd.DataFrame(housing['data'],columns = housing['feature_names'])
housing_df['target'] = housing['target']
housing_df.head()

# if you have downloaded dataset, use below code segment
# housing_df = pd.read_csv('path_to_california_housing.csv')
# housing_df.head()
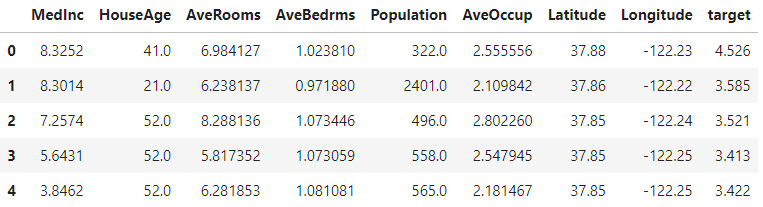
This code snippet demonstrates how to load and prepare the California housing dataset for analysis. First, it fetches the dataset using fetch_california_housing() and stores it in the housing variable. Then, it creates a pandas DataFrame, housing_df, using the dataset's features and target values. The DataFrame includes columns for each feature and an additional column for the target variable. Finally, the head() function displays the first few rows of the DataFrame to give an overview of the data. There is also an alternative code snippet provided to load the dataset from a CSV file if it has been downloaded separately.
Split data into X (inputs), y (outputs), train and test set
X = housing_df.drop('target',axis=1)
y = housing_df['target']

X_train,X_test, y_train, y_test = train_test_split(X,y,test_size = 0.2)
This code snippet prepares the dataset for training and testing a machine learning model. First, it separates the features (X) and target values (y) from the housing_df DataFrame. The features are obtained by dropping the 'target' column, while the target values are isolated in y. Then, it uses train_test_split to divide the data into training and testing sets, with 80% of the data allocated for training the model and 20% (test_size = 0.2) reserved for testing. This split helps to evaluate the model's performance on unseen data.
# Train the model
mdl = RandomForestRegressor(random_state=42)
mdl.fit(X_train,y_train)

# Make predictions
y_preds_regressor = mdl.predict(X_test)


print('Regression metrics on the test set')
print(f"R2 score : {r2_score(y_test,y_preds_regressor)}")
print(f"MAE : {mean_absolute_error(y_test,y_preds_regressor)}")
print(f"MSE : {mean_squared_error(y_test,y_preds_regressor)}")
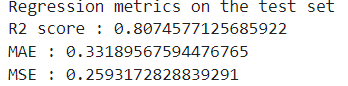
This code trains a RandomForestRegressor model using the training data. It then makes predictions on the test set and evaluates the model's performance using three metrics: R² score, mean absolute error (MAE), and mean squared error (MSE). The results are printed to assess how well the model predicts housing prices. We should always have a higher R² score and lower errors (MAE, MSE).
Manual hyperparameter tuning
In the documentation, you can find a list of parameters that can be tuned for the model. Manually selecting the best values for these parameters can be challenging, especially without extensive experience in machine learning concepts. This process often involves a trial-and-error method, where you test different combinations of parameters to see which ones produce the best results. This manual approach can be time-consuming and requires a good understanding of how each parameter affects the model's performance.
I will use some of the model parameters for demonstrating purpose. You need to invest some time in this topic to understand more.
# Hyperparameter tuning by hand
mdl = RandomForestRegressor(n_estimators=150,
                            max_depth=20,
                            min_samples_split=10,
                            min_samples_leaf=5,
                            max_features='log2',
                            random_state=42)
mdl.fit(X_train,y_train)

# Make predictions
y_preds_regressor = mdl.predict(X_test)


print('Regression metrics on the test set')
print(f"R2 score : {r2_score(y_test,y_preds_regressor)}")
print(f"MAE : {mean_absolute_error(y_test,y_preds_regressor)}")
print(f"MSE : {mean_squared_error(y_test,y_preds_regressor)}")
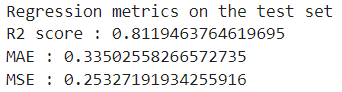
This code trains a RandomForestRegressor model with manually chosen hyperparameters. The parameters set include n_estimators=150 (number of trees), max_depth=20 (maximum depth of trees), min_samples_split=10 (minimum samples required to split a node), closely=5 (minimum samples required at a leaf node), and max_features='log2' (number of features to consider when looking for the best split). After training the model, it makes predictions on the test set. Again the performance is evaluated as usual. If you closely monitor the scores, you can see our R² score has been increased a bit and MSE has been decreased a bit.
Manually tuning hyperparameters can be time-consuming and inefficient, as it often involves a trial-and-error approach to find the best values. This method may not always yield optimal results and can be cumbersome without extensive experience. To address these challenges, techniques like GridSearchCV or RandomizedSearchCV can automate the search for optimal hyperparameters. These tools systematically explore various combinations of parameters, significantly speeding up the tuning process and improving the chances of finding the best model settings.
Hyperparameter tuning using RandomizedSearchCV
# Define the parameter grid
param_dist = {
    'n_estimators': [50, 100, 200],
    'max_features': ['sqrt', 'log2'],
    'max_depth': [None, 10, 20, 30],
    'min_samples_split': [2, 5, 10],
    'min_samples_leaf': [1, 2, 4]
}

# Initialize RandomForestRegressor
rf = RandomForestRegressor(random_state=42)

# Setup RandomizedSearchCV
random_search = RandomizedSearchCV(
    rf,
    param_distributions=param_dist,
    n_iter=50,
    cv=5,
    verbose=2,
    random_state=42,
    n_jobs=-1
)

# Fit RandomizedSearchCV
random_search.fit(X_train, y_train)

# Best parameters and score
print("Best parameters found: ", random_search.best_params_)
print("Best score found: ", random_search.best_score_)

# Evaluate on test set
best_rf_random = random_search.best_estimator_
y_preds_random = best_rf_random.predict(X_test)

print('Randomized Search Regression metrics on the test set')
print(f"R2 score : {r2_score(y_test, y_preds_random)}")
print(f"MAE : {mean_absolute_error(y_test, y_preds_random)}")
print(f"MSE : {mean_squared_error(y_test, y_preds_random)}")
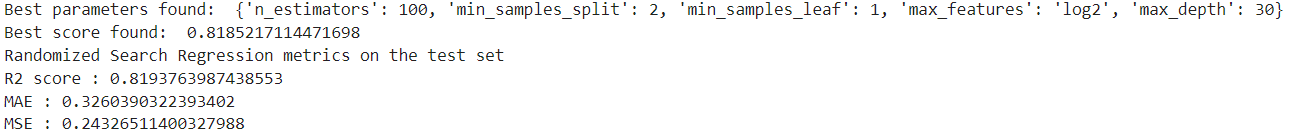
If you closely monitor the scores, here also you can see our R² score has been increased a bit. Also MSE, and MAE have been decreased a bit.
In the param_dist we need to provide list of values for each parameters. Also you need to choose some values for parameters in RandomizedSearchCV. Here also you need to have some experience in choosing values. However, don’t worry if you’re not sure what values to use right now. There are numerous resources available online to help and guide you. Additionally, you will gain experience in selecting these values by regularly testing and practicing these concepts.
The param_dist dictionary defines the range of values to test for each hyperparameter of the RandomForestRegressor.
n_estimators- specifies the number of trees in the forest.max_features- determines the number of features to consider when looking for the best split.max_depth- sets the maximum depth of each tree.min_samples_split- the minimum number of samples required to split an internal node.min_samples_leaf- the minimum number of samples required to be at a leaf node.
RandomizedSearchCV is used to find the best hyperparameters by randomly sampling from the parameter grid.
rfis the model to tune.param_distributions- the parameter grid to search.n_iter=50- specifies the number of different parameter combinations to try.cv=5- sets the number of cross-validation folds.verbose=2- controls the level of detail in the output (higher numbers give more detailed output).random_state=42- ensures reproducibility(Helps to have same outputs each and every time you run the model).n_jobs=-1- uses all available CPU cores for faster computation.
The code print("Best parameters found: ", random_search.best_params_) and print("Best score found: ", random_search.best_score_) shows the best hyperparameters and the highest score achieved during the hyperparameter tuning process. After finding these best parameters, the code best_rf_random = random_search.best_estimator_ retrieves the model with the optimal settings. It then uses this model to make predictions on the test set withy_preds_random = best_rf_random.predict(X_test), allowing you to evaluate how well the tuned model performs on new, unseen data.
Hyperparameter tuning using GridSearchCV
# Define the parameter grid
param_grid = {
    'n_estimators': [50, 100],
    'max_features': ['sqrt', 'log2'],
    'max_depth': [None, 10],
    'min_samples_split': [2, 5],
    'min_samples_leaf': [1, 2]
}

# Initialize GridSearchCV
grid_search = GridSearchCV(
    rf,
    param_grid=param_grid,
    cv=5,
    verbose=2,
    n_jobs=-1
)

# Fit GridSearchCV
grid_search.fit(X_train, y_train)

# Best parameters and score
print("Best parameters found: ", grid_search.best_params_)
print("Best score found: ", grid_search.best_score_)

# Evaluate on test set
best_rf_grid = grid_search.best_estimator_
y_preds_grid = best_rf_grid.predict(X_test)

print('Grid Search Regression metrics on the test set')
print(f"R2 score : {r2_score(y_test, y_preds_grid)}")
print(f"MAE : {mean_absolute_error(y_test, y_preds_grid)}")
print(f"MSE : {mean_squared_error(y_test, y_preds_grid)}")
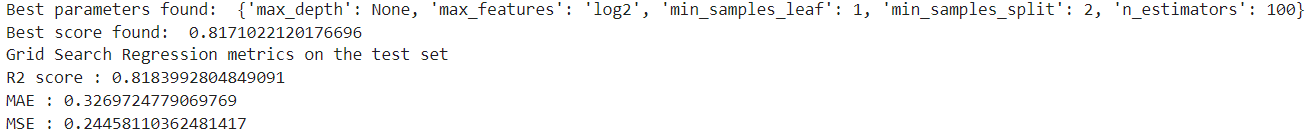
If you closely monitor the scores, here also you can see our R² score has been increased a bit. Also, MSE and MAE have been decreased a bit.
First, it defines a grid of hyperparameter values to test, including options for n_estimators, max_features, max_depth, min_samples_split, and min_samples_leaf.Here also you need to have some experience in choosing values. You will gain experience in selecting these values by regularly testing and practicing these concepts.
GridSearchCV is then initialized with the RandomForestRegressor model, this parameter grid, and cv=5, which means it uses 5-fold cross-validation to evaluate each parameter combination. This cross-validation splits the training data into 5 parts, trains the model on 4 parts, and tests it on the remaining part, repeating this process 5 times to ensure robust evaluation.
After fitting, the code prints the best hyperparameters and the highest score found during the search. It then retrieves the model with the optimal parameters and makes predictions on the test set. Finally, it evaluates the performance of this tuned model using R² score, mean absolute error (MAE), and mean squared error (MSE) to see how well it performs on unseen data.
Here you saw a word called 5-fold cross-validation. Let me explain it.
K-fold cross-validation is a technique used to assess how well a model will perform on new data. Here's a simple explanation:
What it is?
- K-fold cross-validation splits your dataset into KKK smaller sets, or "folds." Each fold gets a chance to be the test set while the remaining K−1 folds are used for training.
How it works?
- Divide the Data - Suppose you have a dataset of 100 data points and choose K=5. The dataset is split into 5 folds, each containing 20 data points.
- Train and Test - For each of the 5 folds, use 4 folds (80 data points) to train the model and the remaining fold (20 data points) to test it. Repeat this process so each fold is used as a test set exactly once.
- Average the Results - After running the model on each fold, you get 5 different performance scores. The final performance measure is the average of these scores.
K-fold cross-validation offers several advantages
- More Reliable Estimates - By using multiple folds, you get a better estimate of how well your model will perform on new data, as it is tested on different subsets of the dataset.
- Efficient Use of Data - All data points are used for both training and testing. This maximizes the use of available data, which is especially useful when working with limited datasets.
- Reduced Bias - It reduces the variability of the performance estimate by averaging results over multiple test sets. This helps in getting a more stable and less biased evaluation of the model's performance.
- Detects Overfitting - Since the model is tested on different folds, it helps in identifying if the model is overfitting to a particular subset of the data. This ensures the model generalizes well across different parts of the dataset.
- Comprehensive Evaluation - It provides a thorough evaluation of the model's performance by assessing it across all different parts of the dataset, rather than just a single train-test split.
I hope you got some basic ideas on hyperparameter tuning. It is a powerful tool for improving your machine-learning model, but it's not the only factor that determines its performance and accuracy. The amount and quality of your data, the choice of algorithms, and even the features you select play crucial roles. Keep in mind that finding the best hyperparameters often involves trial and error, so practice and experience will help you get better at it. Here I just provided basic steps to get started on your journey on hyperparameter tuning. By experimenting with different settings and methods, you can gradually refine your approach and achieve better results.
If you found this article helpful, subscribe to me for more like this. Also, make sure you follow me on LinkedIn.