How to Choose the Best Model for Your Machine Learning Problem

Finding the right machine learning model can feel like finding a needle in a haystack. With so many options out there, how do you know which one to choose? Don’t worry! This guide will help you figure it out by breaking down the process into simple steps, using the scikit-learn model selection map as your guide.
Note - This guide is for those who don't have any idea to choose a suitable model. If you are experienced with basic concepts, you may not want to continue reading this blog.
Understanding the Problem and Your Data
Before you dive into choosing a model, you need to understand your problem and data . Think of this as knowing what kind of puzzle you're trying to solve before you pick the pieces.
You need to figure out what type of problem you're dealing with first. Is it a classification problem, clustering problem, or something else? This step is crucial before you even start implementing and training your models. Let's dive into each type of problem to understand them better.
1. Classification
What is it?
Imagine you have a toy box with different types of toys—cars, dolls, and blocks. Classification is like sorting these toys into their correct bins. You look at each toy and decide which bin it should go into.
Real-World Example
Now, think about your email inbox. Imagine you want to sort all your emails into two groups: “spam” (unwanted emails) and “not spam” (important emails). This task is a classification problem because you're deciding which category each email belongs to.
2. Regression
What is it?
Think about how you might guess the weight of a fruit based on its size. Regression is like predicting this weight using a formula that takes the size into account. It’s all about predicting a specific number.
Real-World Example
Let’s say you want to estimate the price of a house based on its size and location. If you have a formula that uses these details to guess the price, that’s a regression problem. You’re predicting a numerical value based on other information.
3. Clustering
What is it?
Imagine you're organizing a party and you want to group your friends based on what they enjoy doing—some like dancing, some like chatting, and others like games. Clustering is like figuring out these natural groups without any predefined labels. You just observe how people naturally group together.
Real-World Example
Think about a store that wants to group its customers based on their shopping habits. By looking at their buying patterns, the store can find clusters of similar customers, like those who frequently buy sports equipment or those who prefer luxury items. This process of grouping similar customers is called clustering.
4. Dimensionality Reduction
What is it?
Imagine you’re going on a trip and need to pack a suitcase. You have lots of items but only a limited amount of space. Dimensionality reduction is like figuring out how to pack your suitcase so that you fit everything important while leaving out unnecessary items.
Real-World Example
Suppose you have a dataset with lots of features, such as age, height, weight, and many more. Dimensionality reduction helps you simplify this dataset by reducing the number of features while retaining the key information. It’s like keeping just the essentials in your suitcase to make it easier to handle without losing anything important.
Okay... I think you have got some idea on the problem types. We can took all above mentioned types in to two mainn categories. Those are called supervised machine learning and unsupervised machine learning. Let's understand it.
Supervised vs. Unsupervised Learning
Understanding whether your problem falls under supervised or unsupervised learning is key. It’s like choosing between using a map or exploring on your own.
Supervised Learning
What is it?
Supervised learning is like having a teacher who guides you with answers. You have labeled data (input-output pairs) and the model learns from it.
Ex :-
- Classification - Where you have labels like “spam” and “not spam.”
- Regression - Where you have numerical outcomes like house prices.
Unsupervised Learning
What is it?
Unsupervised learning is like exploring without a map. You don’t have labels, so the model finds patterns on its own.
Ex :-
- Clustering - Grouping similar items, like finding customer segments.
- Dimensionality Reduction - Simplifying data to make it easier to understand.
Now we are going to focus on the data.
When you’re understanding your data, there are several key concepts to know when you choose the right machine learning model. Here’s a breakdown of what to look at
1. Numerical Data
What is it?
Numerical data consists of numbers and can be further categorized into discrete and continuous data.
- Discrete Data - Whole numbers, like the number of students in a class. It’s countable. (Ex - 32, 123, ...)
- Continuous Data - Numbers that can take any value within a range, like temperature or height. (Ex - 1.223, 1.0, 5.53627, ... )
Numerical data is often used in regression tasks where you predict a continuous value, but it can also be used in classification when the numbers represent categories.
2. Categorical Data
What is it?
Categorical data represents categories or groups. It can be either nominal or ordinal.
- Nominal Data - Categories with no natural order, like colors (red, blue, green).
- Ordinal Data - Categories with a specific order, like education levels (high school, college, graduate).
Categorical data is often used in classification problems where you need to predict categories or classes.
3. Mixed Data Types
What is it?
Often, datasets contain both numerical and categorical data. Understanding how to handle mixed data types is crucial for preprocessing.
Mixed data types can affect how you preprocess and feed data into models. For example, categorical data may need to be encoded into numerical format.
Examples
- Customer Data - Includes numerical values (age, income) and categorical values (gender, country).
4. Text Data
What is it?
Text data includes any form of written information, such as reviews, tweets, or documents.
Text data is often used in natural language processing tasks. It requires special preprocessing to convert text into numerical features that models can understand.
Examples
- Customer Reviews - Unstructured text data.
- Emails - Another form of text data.
5. Time Series Data
What is it?
Time series data is collected over time, where each data point is associated with a specific timestamp.
Why it matters
Time series data is used to predict future values based on historical trends. It often requires specific models that account for time-based patterns.
Examples
- Stock Prices - Historical prices over time.
- Weather Data - Temperature and humidity recorded daily.
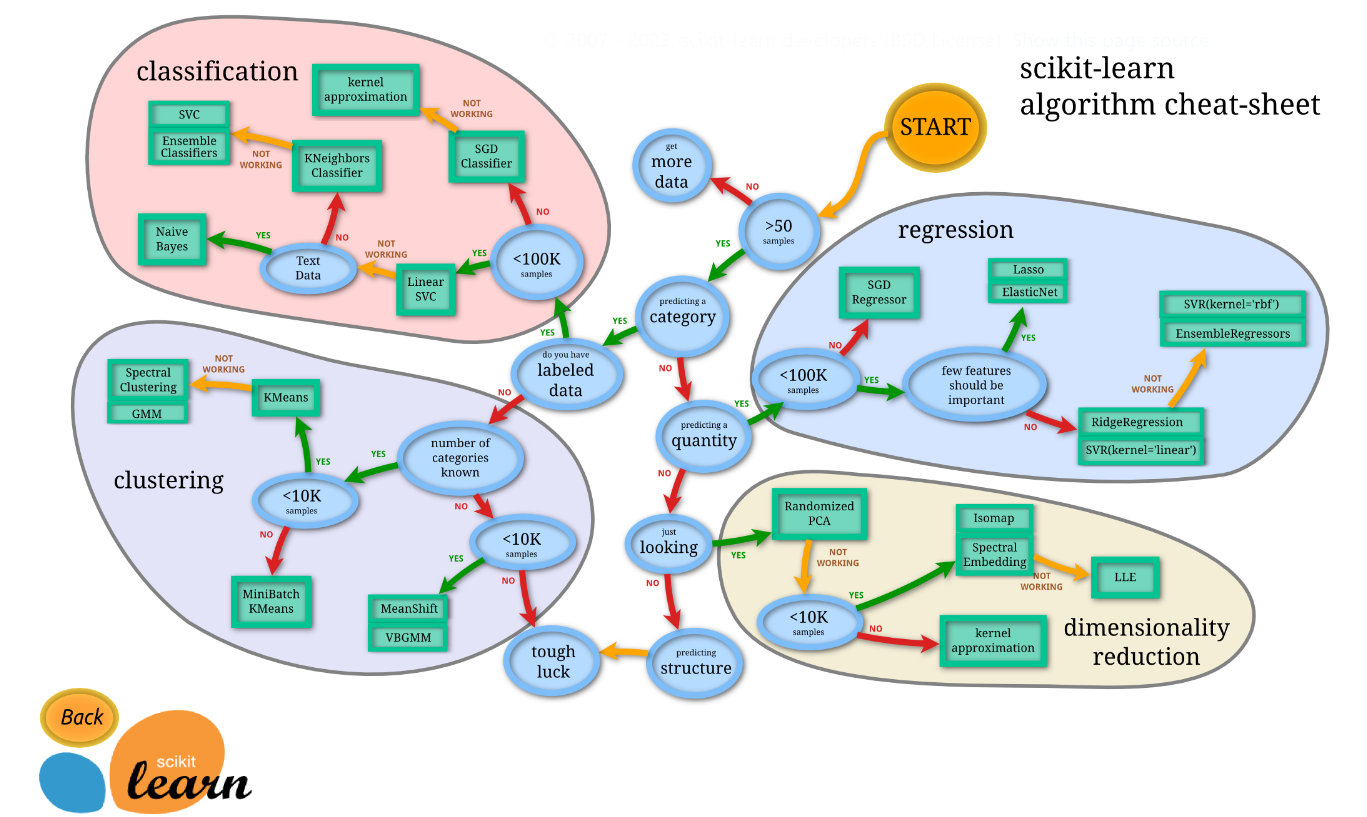
Alright, now that we’ve covered the basics, let’s dive into our main topic: “How to choose the best model for your machine learning problem.” To do this, we'll follow the guidance from the scikit-learn official documentation.
Important Note: The documentation provides minimum requirements for choosing models. Keep in mind, though, that having more data usually helps the model perform better and achieve even better results.
Sample Data Table
| Feature 1 | Feature 2 | Feature 3 | Feature 4 | Output |
|---|---|---|---|---|
| 1.1 | Text A | 3.2 | Text B | 15.7 |
| 1.2 | Text C | 3.3 | Text D | 16.1 |
| 1.3 | Text E | 3.4 | Text F | 16.5 |
| 1.4 | Text G | 3.5 | Text H | 16.9 |
| 1.5 | Text I | 3.6 | Text J | 17.3 |
| 1.6 | Text K | 3.7 | Text L | 17.7 |
| 1.7 | Text M | 3.8 | Text N | 18.1 |
| 1.8 | Text O | 3.9 | Text P | 18.5 |
| 1.9 | Text Q | 4.0 | Text R | 18.9 |
| 2.0 | Text S | 4.1 | Text T | 19.3 |
If you don't have at least 50 records of data, they suggest to collect more data. To have a better model you must collect more and more data. 70% - 80% (Usually 80%) of your data for training the model and 20% - 30% (Usually 20%) of your data for the testing model. Sometimes we use 70% of the data for training, 15% of the data for validation, and another 15% of the data for testing the model.
According to the map, if you have more than 50 records, you should first check whether the output column is categorical or numerical (In our case it is numerical). If the output column contains categorical values, you are dealing with either a classification problem or a clustering problem. If the output column contains numerical values, you are dealing with either a regression problem or a dimensionality reduction problem.
Let's assume we are predicting a categorical feature. So we are having either a classification problem or a clustering problem. To be more specific, we need to identify whether we have labeled data or not.
Labeled Data
Each data point has a known class or category. This means you know the outcome or label for each data point.
- Example - Predicting if a flower is of type Iris-setosa, Iris-versicolor, or Iris-virginica based on the features (Sepal Length, Sepal Width, Petal Length, Petal Width).
| Sepal Length | Sepal Width | Petal Length | Petal Width | Species |
|---|---|---|---|---|
| 5.1 | 3.5 | 1.4 | 0.2 | Iris-setosa |
| 6.2 | 2.9 | 4.3 | 1.3 | Iris-versicolor |
| 7.3 | 2.9 | 6.3 | 1.8 | Iris-virginica |
You train a model to predict the species based on the features (Sepal Length, Sepal Width, Petal Length, Petal Width).
Unlabeled Data
The data points do not have predefined labels or outcomes. You only have the input features and need to find patterns or groupings.
- Example - Grouping customers based on their purchase behavior.
| Age | Income | Purchase Frequency |
|---|---|---|
| 25 | 50000 | 3 |
| 45 | 100000 | 10 |
| 35 | 75000 | 5 |
There are no predefined labels or categories for the data. The goal is to identify natural groupings or clusters within the data. For example, you might discover clusters representing different customer segments like "Young High Spenders" or "Middle-aged Frequent Buyers."
I think, now you have an idea for choosing a model for predicting a category. By going forward using the map, you can choose suitable estimators (Models) which is in the green boxes on the map.
Now, Let's assume we are not predicting a category. Then we are having either a regression problem or a dimensionality reduction problem. To be more specific, we need to identify whether we are predicting a quantity or not.
Predicting a Quantity
This involves forecasting a specific numerical value based on input features. This is a regression problem.
Example - Predicting house prices based on various features.
| Size (sq ft) | Bedrooms | Age (years) | Price ($) |
|---|---|---|---|
| 1500 | 3 | 10 | 300000 |
| 2000 | 4 | 5 | 450000 |
| 2500 | 5 | 20 | 500000 |
The Price ($) column represents the quantity we are predicting. The goal is to estimate this price based on features like Size, Bedrooms, and Age.
Dimensionality Reduction
This involves reducing the number of features while retaining important information (Transforming data from a high-dimensional space to a lower-dimensional one without losing crucial information). This is not about predicting a quantity but simplifying the data structure.
Purpose - Simplifying data, improving model performance, visualization, and handling the "curse of dimensionality.
Example - Reducing the number of features for analysis or visualization
| Feature 1 | Feature 2 | Feature 3 | Feature 4 |
|---|---|---|---|
| 0.5 | 1.2 | 3.4 | 0.9 |
| 1.0 | 0.8 | 2.1 | 1.5 |
| 0.7 | 1.1 | 3.0 | 1.2 |
This data represents features from a dataset where dimensionality reduction techniques might be applied. The goal is not to predict a specific quantity but to simplify the dataset for better analysis or visualization.
I think, now you have an idea for choosing a model for not predicting category as well. By going forward using the map, you can also choose suitable estimators (Models) which is in the green boxes on the map.
From here onwards, it's not about saying one model is better for classification and another for regression. Machine learning is all about experimenting with different estimators (models) until you find the right choice. Depending on your dataset and specific situation, you may discover a better model through experimentation. This guide is intended to help you get started on this process. It’s your responsibility to experiment and choose the best-fitting model for your problem.
If you found this article helpful, subscribe to get more articles like this. Also, make sure to follow me on LinkedIn!